Working with Dashboard
Zoho Analytics offers a wide range of interactive options for dashboards when accessed by an end-user. The options include Viewing Underlying data, sorting, exporting, sharing and publishing. In this section, we will discuss each of the below-mentioned options in detail.
Interactions with Dashboards
Dashboards enables you to do exploratory analysis using immersive and interactive features. In this section, we are going to learn about the advanced interactive features such as View Underlying Data, Drill down and Change Chart Type.
Note
All these capabilities are available in the View Mode only.
View Underlying Data
Users of a dashboard can view the underlying data of a report in the dashboard.
To view the underlying data of a chart,
- Click the data point for which you wish to view the underlying data.

- Select View Underlying Data.

- The underlying data of the data point will be displayed as shown below.


Alternatively, you can also view the entire underlying data of the report by clicking the More option and selecting View Underlying Data.

Explain Data - Zia Insights
Gain deeper understanding of your data for any specific data point using Zia Insights.
To view insights,
- Click on the data point you want to analyze.
- Choose the Explain Data - Zia Insights option.

- Zia Insights will then display detailed explanations and insights for the selected data point, as shown below.


Drill Down
The Drill Down option allows you to perform powerful exploratory analysis. Using this feature, you can click on any data point in a chart and visualize the underlying data as a chart. You can either drill down using the path that is already set for the chart or choose from the list of compatible columns suggested by Zoho Analytics. Click to learn more about the drill down option.
To drill down a chart,
- Click the data point that you wish to drill-down.
- Zoho Analytics offers two options to drill down - Drill Down and Drill Down By.
- Drill Down will only allow you to drill down the chart based on the column that is set as a drill down path while creating the chart.
- Drill Down By option will allow you to dynamically select a column from the wide list of columns that you can use to drill down the chart.
- In this example, we are going to see how to drill down a chart using the Drill Down By option.

- Select the column by which you wish to drill down.

- The chart will get drilled down/get structured based on the path selected by you. The path will be displayed as a breadcrumb on the top.

Click to learn more about the drill down option.


Note
- It will be available only if the user who has shared the dashboard with you has granted the Drill down permission for you while sharing the dashboard.
Change Chart Type
Zoho Analytics allows you to visualize the chart that you have created using different chart type options. You can change the chart type of individual charts in a dashboard by clicking the Change Chart Type option. Please do note this is applicable only for a particular session and cannot be saved.

Sync Pan and Zoom Movements Across Maps
Keep your maps in sync as you explore data across geographies. When enabled, zooming and panning on one map automatically mirrors the same view across other compatible maps on the same dashboard, making it easier to compare regional data side by side. This includes scroll gestures, drag to pan, and +/– zoom buttons.
Sync pan and zoom movements across maps is enabled by default when you open or create a dashboard. For two maps to sync, they must meet the following conditions:
- They must use the same projection type - either both Mercator or both Albers USA projection.
- They must display the same geographic scope. For example, two maps showing the entire world will sync, but a map showing only the United States and a map showing only India will not.
When the Home button is clicked, each map returns to its own saved home view. If maps have different home configurations, sync applies only when their bounds are similar.

To disable pan and zoom sync across maps,
- Navigate to Settings on your dashboard.
- Locate Sync pan and zoom movements across maps and toggle it Off.
Note:
- This setting is tab-specific. Maps on other tabs of the same dashboard are not affected.
- Maps with no data are excluded from sync and will not be affected by zoom or pan actions from other maps.
- Zoom and pan state is not retained in exports.
Maximize Embedded Report
You can maximize the embedded report to view in full dashboard layout by following the below steps.
- Click the Maximize icon in the top left corner of the report. You can also Double-click on the header to do the same.
- The report will open in full dashboard layout. Rest of the components will be hidden, except the user filter. However, when you apply the user filter in this mode, it will be applied to all components in the dashboard.

- If required, you can choose to edit the report by clicking the Edit icon. The reports in edit mode will open in new tab. You can modify the report as needed.

- Click Minimize icon to revert to the embedded size.


Exporting and Emailing Dashboard
Zoho Analytics provides exporting and emailing capabilities that allow you to access dashboards offline and securely share them with users who do not have a Zoho account.
Exporting Dashboard
Zoho Analytics allows you to export your dashboards in various file formats. Follow the below steps to export any dashboard.
Open the dashboard and click the Export icon to explore the export options.
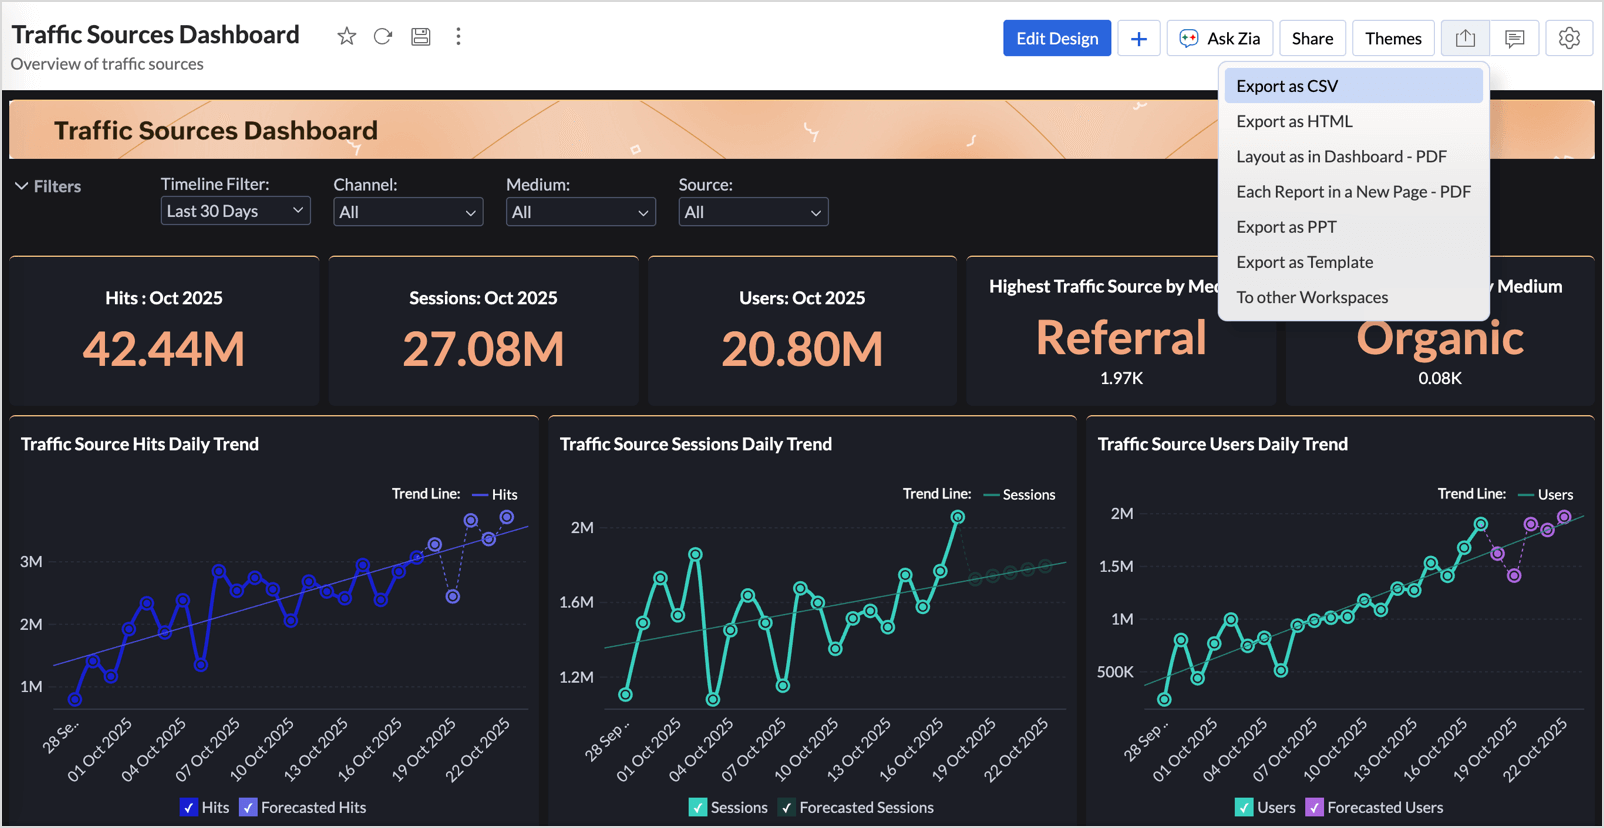
Zoho Analytics allows you to export a dashboard in the following file formats
- Export as CSV
- Export the dashboard data in CSV format.
- You can include column headers, user filter criteria, drill-down flow, and row numbers; configure column, record, and text separators.
- Export as HTML
- Export an HTML file of the dashboard.
- You can customize layout elements, titles, and background settings.
- Layout as in Dashboard (PDF)
- Export the dashboard as a PDF that retains its original layout and visual design.
- You can add headers, footers, and watermarks; adjust margins and orientation; and enable password protection.
- Each Report in a New Page (PDF)
- Export each report in the dashboard as a separate page within a single PDF file.
- You can define the page layout and include headers, footers, and watermarks.
- Export as PPT
- Export the dashboard as a presentation.
- You can choose from the presentation themes and templates for a polished look.
Note: All exported files can be protected with a password to ensure secure access. Click here to learn more.
Along with these export options, Zoho Analytics offers two other export options.
- Export as Template
- Save the dashboard structure as a reusable template without including the underlying data.
- This allows you to maintain a consistent layout and design across multiple dashboards.
- Export to Other Workspace
- Export the dashboard, along with its associated reports and data models, to another workspace within Zoho Analytics.
Export a Report
Apart from exporting the dashboard as a whole, Zoho Analytics also provides an option to export the individual reports in the dashboard.
To export a report,
- In the View Mode, select the More icon that appears on mouse over
- Select Export and choose the file type that you wish to export the report as.

Emailing Dashboard
Zoho Analytics allows you to e-mail your dashboard to your colleague and clients. You can also schedule emailing your dashboards.
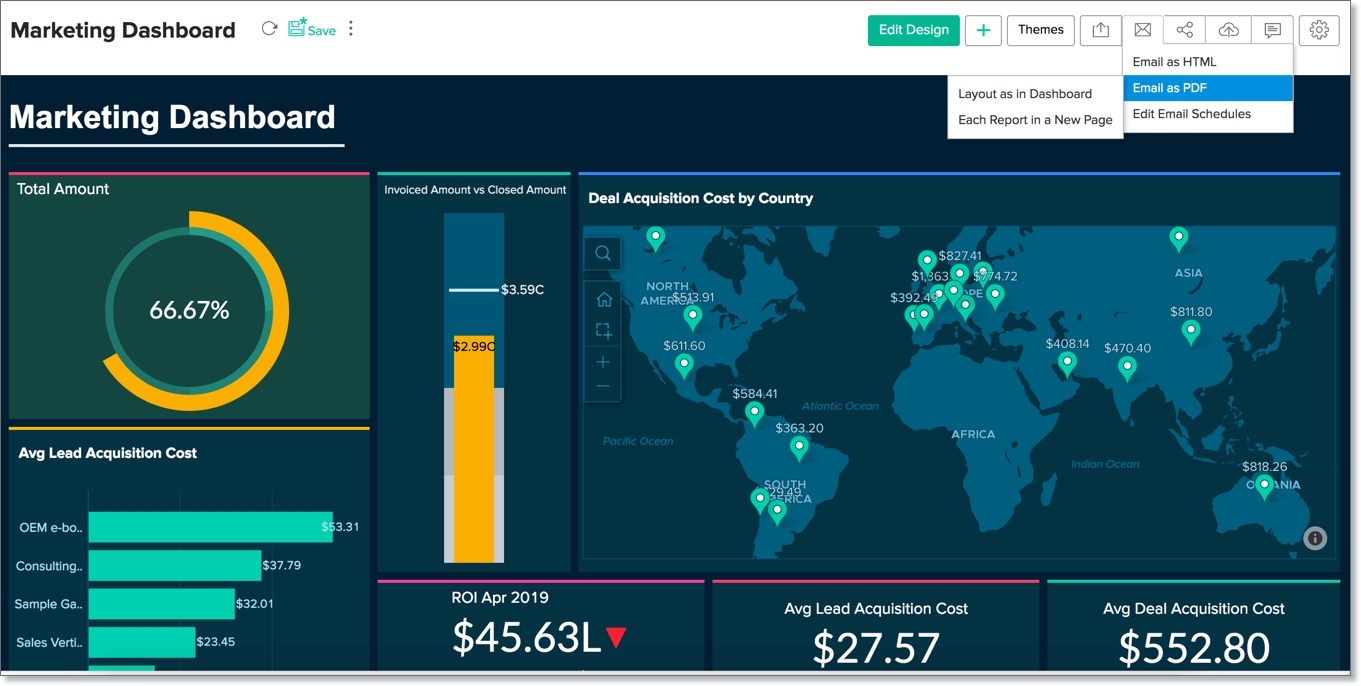
To e-mail your dashboard follow the given steps:
- Click the E-mail icon and select one of the following options.
- Email as HTML - Email the dashboard in HTML file format.
- Email as PDF - Email the dashboard in Portable Document Format (PDF) file format.
- E-mail tab provides various options to specify users email addresses and to customize your message.

- Specify the email addresses in the Enter E-Mail Addresses text box. You can enter the email addresses by typing them or by selecting from Zoho Contacts/Shared User list.
- Customize your e-mail subject and message using the Subject box and the Message box respectively.
- Specify whether the dashboard should be mailed As an in-line Message or As Attachment in the Mode. This option is available only for emailing as HTML file.
- You can also schedule to send the exported copy at a recurring date and time using the Schedule this Email options.
- Click Send to send the report to the specified users.


Other settings will be similar to that on Exporting option. For details refer to the corresponding section in the Exporting Dashboard document.
Sharing your Dashboard
Zoho Analytics allows you to share your Dashboards to your Users and set permissions like Read, View Underlying Data, Drill Down, Export, and Share such that the shared users would be allowed to do only permitted actions when they access the shared dashboard.
Refer to the topic Sharing and Collaboration to know how to share your dashboard.
Publish your Dashboard
Zoho Analytics also allows you to embed the dashboards you create in a website, web application, blog or an intranet page.
Refer to the topic Publishing Options to know how to publish your dashboard.